
Most of us are fortunate to be on LTE or 5G mobile plans with unlimited data, and many have 1GB downstream internet at home. Unfortunately, many people still have limited broadband or are on expensive mobile plans capped by monthly data caps, with penalties for exceeding the allotted data per month. In many parts of the world, users subscribe to mobile plans billed on a megabit per month basis. Businesses need to be mindful of these constraints and aim to deliver optimized websites and web applications delivering quality user experiences calibrated to performance. Improving web performance has a direct correlation to a company’s bottom line. Amazon calculated that if their page load times increase by just one second, it would cost them $1.6 billion in sales every year. Google discovered that slowing their search results by just four-tenths of a second resulted in 8 million fewer searches per day.
Performance should be planned from project inception and carried through till the final launch of the website or application. It used to be many developers tackled performance at the end as an afterthought. Typically this involved simple measures such as minification, concatenation, simple image optimization, and maybe some modifications to server settings. These are beneficial strategies to include in a build workflow, but they are not sufficient in delivering real-world improvements to user experience.
The first step towards better optimization is establishing a culture that understands and values the importance of performance. There needs to be a strong buy-in from all team members, from sales and marketing to development and design. Run experiments demonstrating how minor optimizations improve the user experience by comparing device performance on optimized versus non-optimized sites. Explore how enhancing performance leads to higher user retention and consequently improved conversion or increased sales. Use this information to establish clearly defined and measurable goals that can be adhered to throughout the project life cycle.
If you can’t measure it, you can’t improve it. What tools are we using to measure performance, and are those tools reliable and repeatable? We need to establish which metrics we are attempting to capture and how meaningful those data points are. Some of these metrics could be Page Load Time (PLT), First Meaningful Paint (FMP), Largest Contentful Paint (LCP), and Time to First Byte (TTFB). After defining what metrics will be measured and the current baseline numbers, we need to compare these performance metrics to our competitors and the more extensive web. Two widely published reports providing valuable data are HTTP Archive, lab-base data, and the Chrome UX Report, real-world user reports.
Analyze the data
HTTP Archive is a lab-based report compiled from crawling the top sites on the web monthly and recording detailed information about how digitized content is constructed and served on mobile and desktop devices. There are numerous helpful performance reports, including The Loading Speed Report, analyzing performance metrics in the lifecycle of a loading page, the Page Weight Report , tracing the size and quantity of popular web page resources, and State of the Web Report, capturing efficient network utilization. These reports are all very helpful in establishing the minimum goals and providing a common data set from which to conduct web performance research.
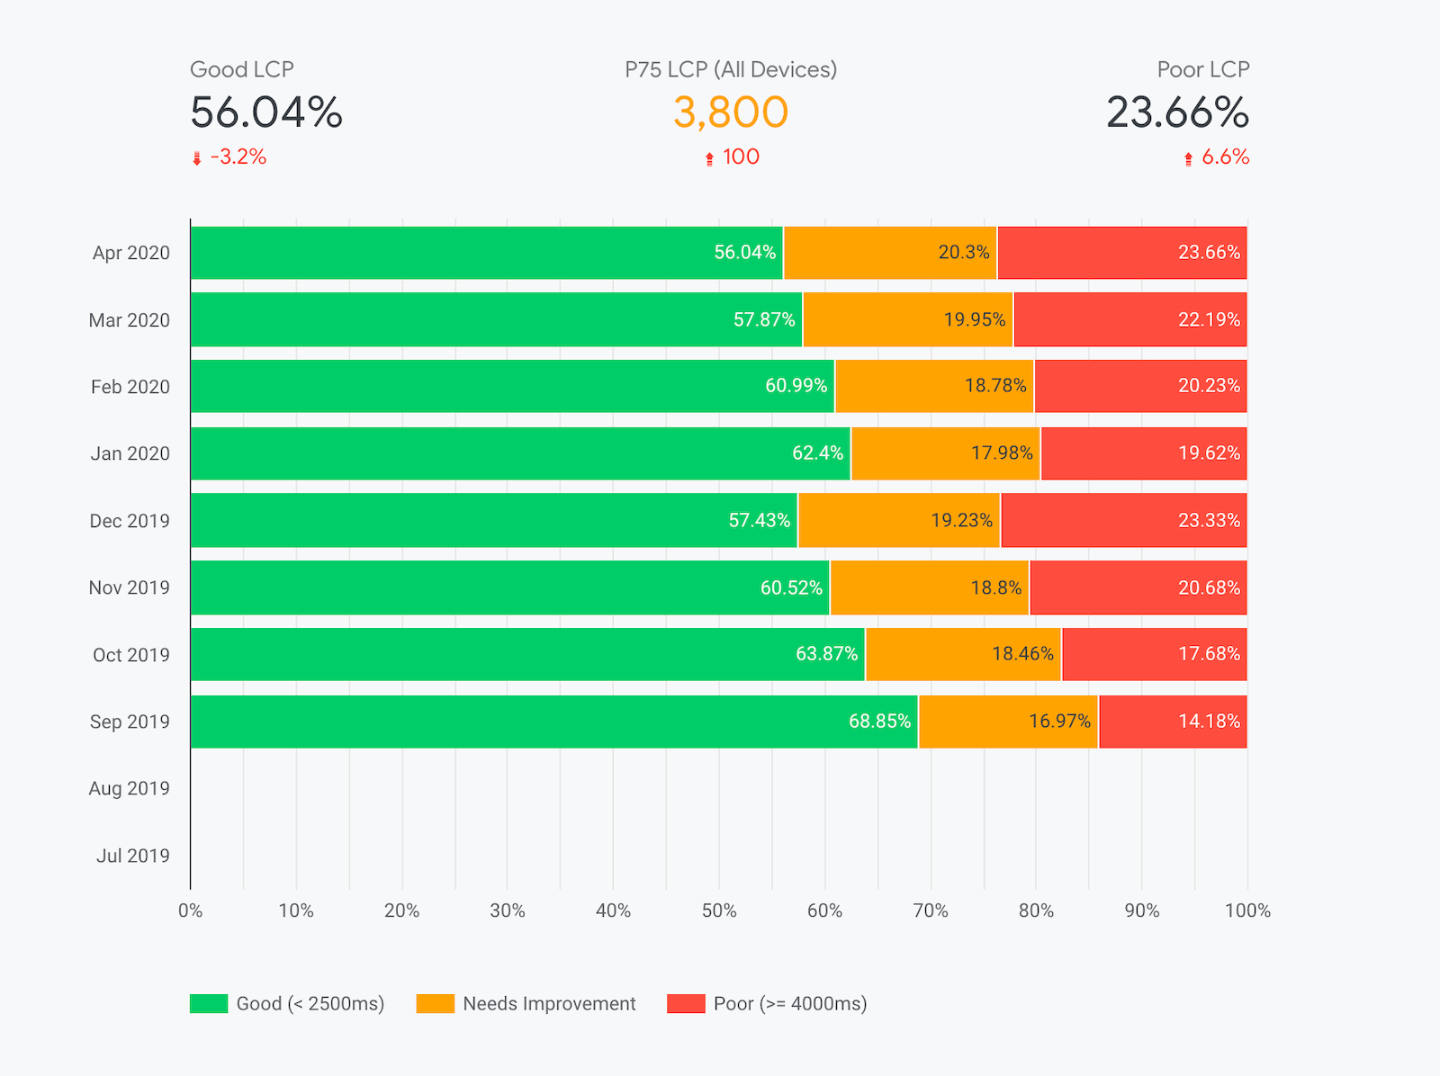
The Chrome User Experience Report (CrUX) provides user experience metrics for how real-world Chrome users experience popular destinations on the web. It includes data on millions of websites measuring Core Web Vitals and contains qualitative dimensions about user’s experience, including device and connection types, which enable us to examine user experience grouped by similar technologies. The data from this report help us understand real-world users’ experiences between websites and web segments, such as an exceptionally competitive industry.
The CrUX dataset provides three core use cases: competitive analytics, allowing you to make head-to-head comparisons utilizing real-world user experiences sliced by device type, network connection types, and client country; vertical benchmarking, providing industry performance trends comparing your site’s performance versus your competition; and monitoring of macro trends, illustrating how our site is performing compared to the entire web across a collection of metrics attempting to quantify what exactly is a good user experience.
Tools for measuring performance
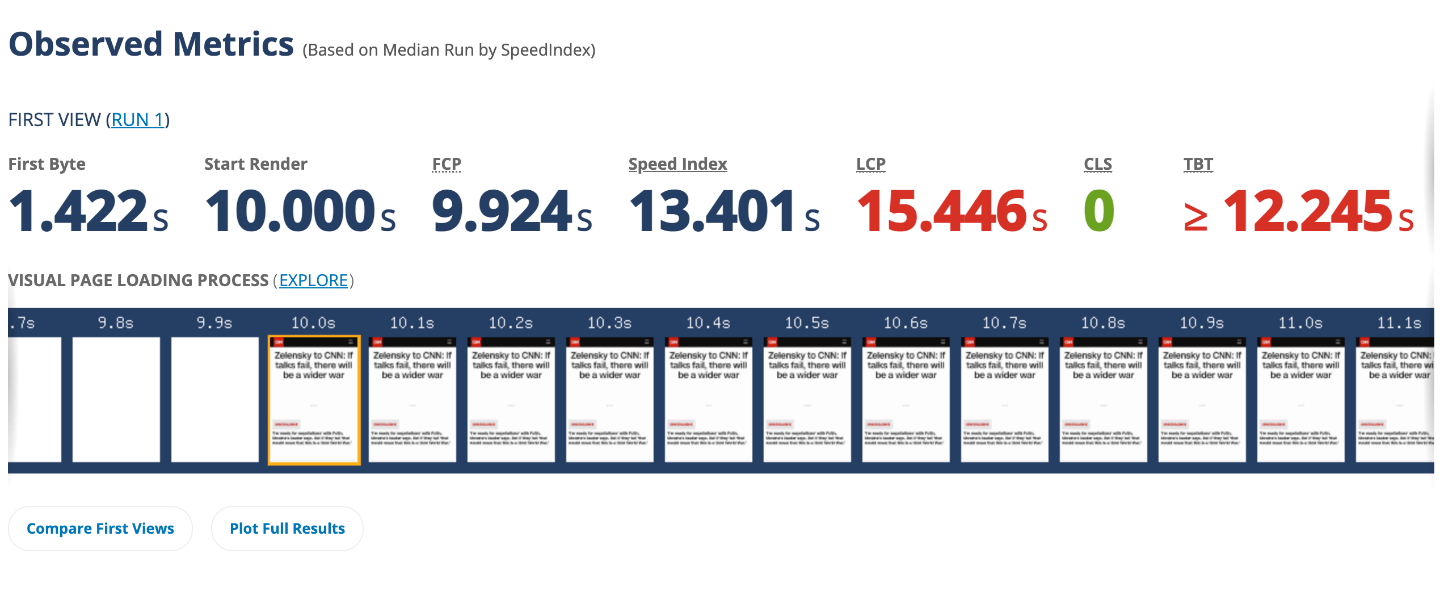
Several tools are available that analyze performance and deliver scores graded against these publicly available datasets. For local testing, monitoring and diagnostics, there is WebPageTest and Lighthouse. WebPageTest is a free online tool that measures web performance metrics in real browsers, devices, and global locations allowing users to run an instant test and get a cascading performance audit of their web pages and applications. Lighthouse is an automated tool from Google, run in Chrome DevTool command line or as a Node module, that generates a report on how well a page performs and provides suggestions on improving the page.
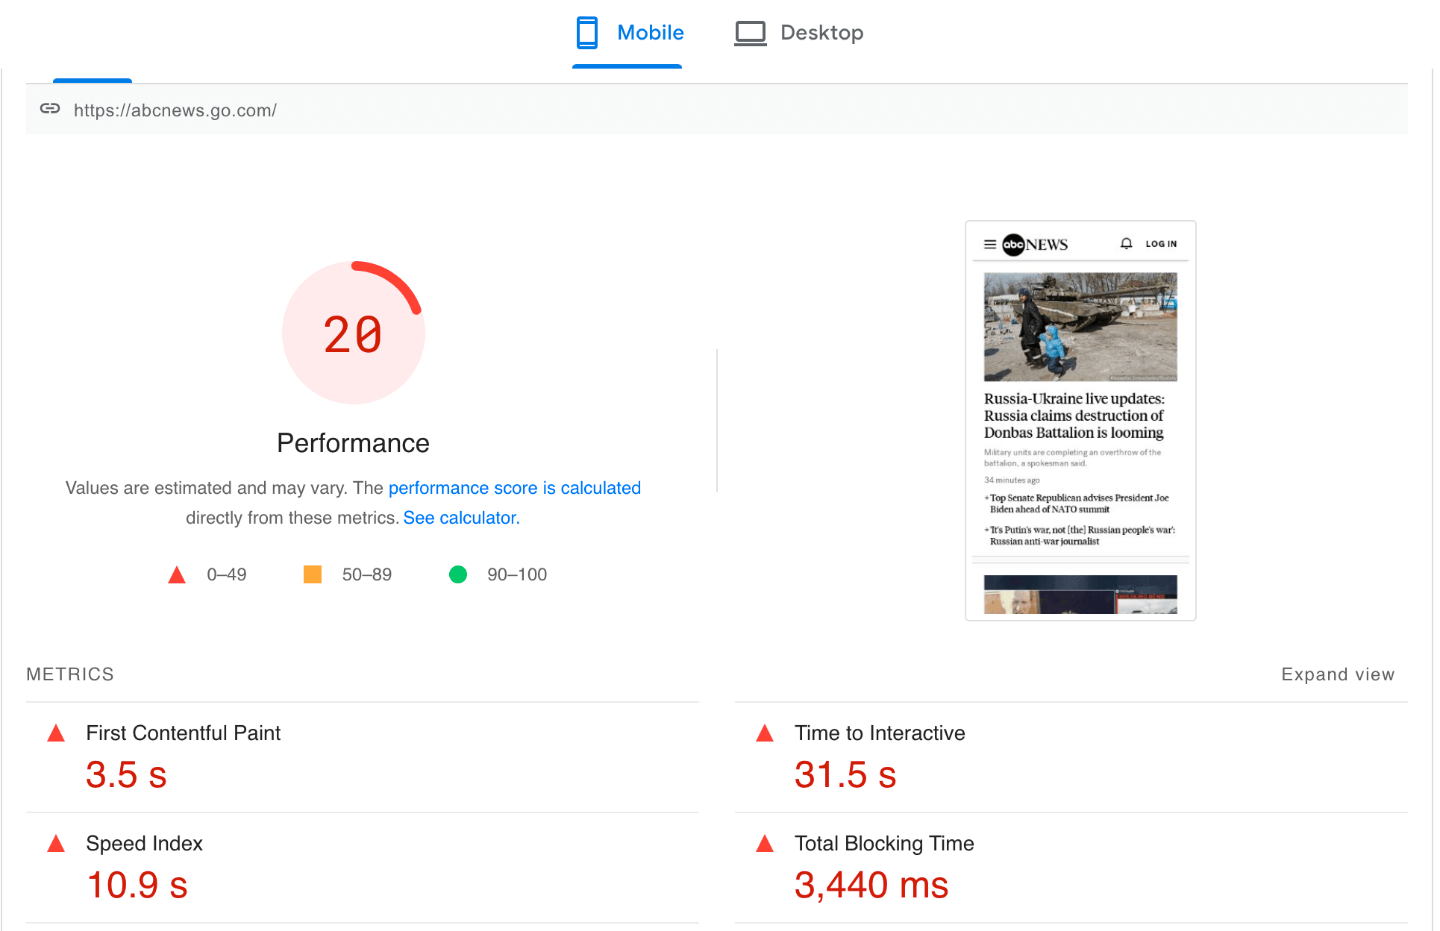
For real-world performance data, PageSpeed Insights (PSI) is the standard tool of choice for reporting performance scores on both mobile and desktop devices. Whereas the previous tools mentioned only use lab data about a page, PSI provides both lab and field data capturing actual, real-world user experience powered by the CrUX dataset. The Chrome UX Report Compare Tool provides a quick overview of your site’s field data and compares the score to the real-world performance of your competitor’s sites.
Setting a performance budget
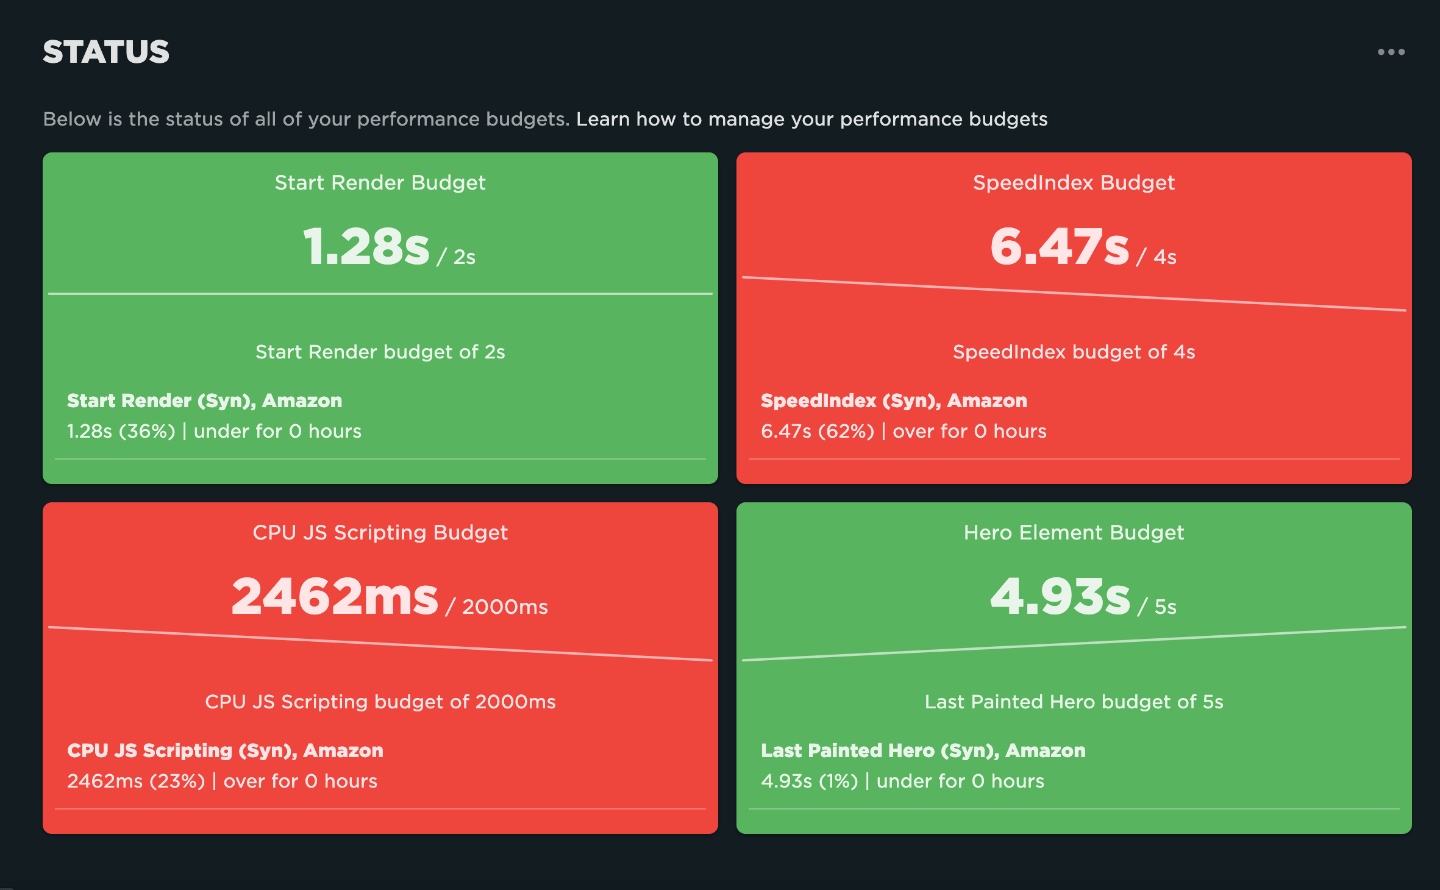
After collecting data on site performance and comparing it to other sites, creating a performance budget is the next step. A performance budget is a predefined limit for pages set by the team, which cannot exceed certain metrics. Some examples could be a specific load time for mobile, a total image size budget, or a minimum time till a user is first able to interact with your site. It is crucial to establish a predefined budget during a project’s formative stages and then frame subsequent design and development decisions against those choices. But one should not stop here; performance budgets should be adhered to throughout the project lifecycle, especially after launch. A performance budget should not constrain the type of content or asset you need to deliver. Instead, the focus should be on how you choose to display that content. Removing important images is not a performance strategy. Instead, mechanisms should be in place to deliver those images in the most optimized fashion.
Once you’ve established a strong performance culture within your organization, reinforced with user education and guided by a realistic performance budget, you should set up monitoring tools, like SiteSpeed, Calibre, or SpeedCurve which provide automatic alerts whenever exceeding a specific metric. If this is too much overhead, run a periodic performance test using one of the previously discussed tools. Performance does not need to be laborious or overly complex. Small organizational changes can have profound impacts on user engagement and conversions. Businesses and other organizations exist to deliver outcomes, whether to make sales, educate users or offer services. When everyone understands the relationship between performance and business metrics, user experiences and organizational goals will vastly improve.